- What is gridded population data?
-
Gridded population data are estimates of the population in small regularly-shaped grid squares as small as a city block.
Gridded population data give analysts the flexibility to model phenomena at a local level across a surface (e.g. Utazi et al 2018, Alegana et al 2016), or to re-aggregate data to new geographic units that are more relevant to the study (Tatem 2017).
- How are gridded population datasets made?
-
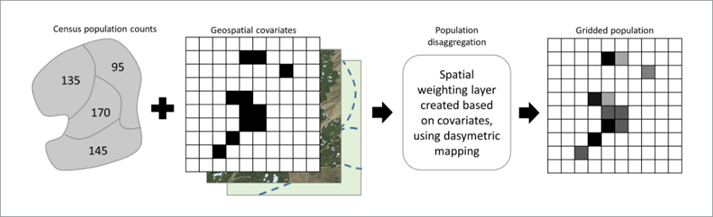
Top-down gridded population estimates
Standard “top-down” gridded population datasets are made by integrating census counts (or official population estimates), linked to their respective geographic boundaries, with satellite and geographic information system (GIS) data layers. Most “top-down” models disaggregate counts of population to small grid squares based on one or more geospatial layers - such as roads, land cover type, topography - using areal weighting, machine learning, or other geostatistical methods (Stevens et al 2015).
Several global “top-down” gridded population datasets are available including WorldPop Global, WorldPop individual country datasets, LandScan-Global, GHS-POP, and GPWv4. GridSample uses WorldPop Global data because it was recently updated, is available at the lowest geographic scale (100m X 100m), leverages the most accurate machine learning methods, is representative of residential population, and is free and publicly available. Due the modeling technique used, WorldPop Global estimates a very small non-zero probability of persons located in remote areas, for example, estimating 0.001 persons per 100m X 100m grid cell in deserts and forests.
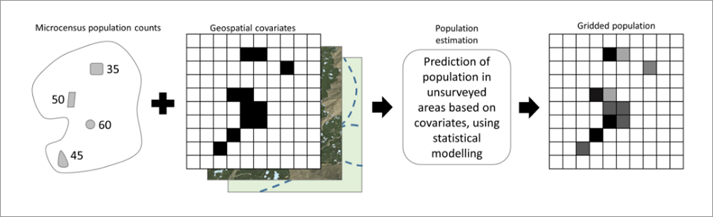
"Bottom-up" gridded population estimates
“Bottom-up” gridded population datasets are census-independent but are not yet available at scale. In “bottom-up” gridded population models, a statistical relationship is established between population density derived from microcensus surveys and spatial covariates. Microcensus surveys count all people in a selection of small areas. This relationship is used to predict population density in grid cells where a microcensus was not performed based on spatial covariates alone. An approachable explanation of these models is available at Wardrop et al 2018. On-going “bottom-up” gridded population modelling initiatives covering low- and middle-income countries include GRID3 and LandScan-HD.
CDR-enhanced gridded datasets
CDR-enhanced gridded datasets are made by integrating aggregated call detail records Call Detail Records (CDRs) from mobile phone operators with “top-down” or “bottom-up” population data. The result is a custom-made gridded population dataset for settings where populations are highly dynamic, for example during armed conflict, or during and immediately after a natural disaster (Deville et al 2014 and Erbach-Schoenberg et al 2016).
Contact us to discuss options to generate a custom CDR-enhanced gridded population dataset for your survey or fieldwork:
- How does GridSample compare to census-based sampling?
-
GridSample reproduces typical complex survey designs with gridded population data rather than census data. GridSample additionally allows for spatial oversampling, and generation of clusters of custom population size.
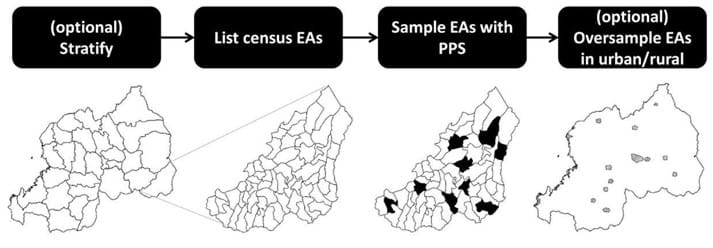
A census-based national household survey is representative of sub-national regions and of urban/rural areas called strata. Within strata, small geographic units - usually enumeration areas from the last census - are listed and then sampled with probability proportional to population size (PPS). The sampled areas are called clusters. If the number of clusters in either urban or rural domain does not meet the cluster sample size requirement, then the under-represented domain may be oversampled.
Census-based survey
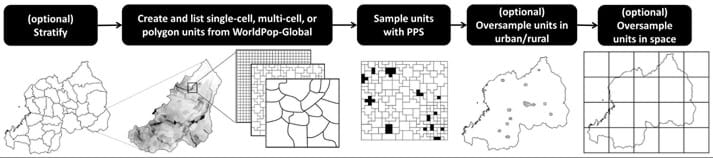
GridSample reproduces these steps, except rather than listing census enumeration areas, a sample frame is created from grid cells. The sample frame is defined as either grid cells with uniform area, multi-cell units with uniform population totals, or user-specified boundaries with population totals calculated from a WorldPop Global gridded dataset. In GridSample, urban/rural areas can be oversampled by stratifying and specifying a custom number of clusters per stratum. Unlike typical samples, GridSample also allows oversampling in space by ensuring at least one cluster per coarse grid cell.
GridSample-based survey
- What is a spatial oversample, and when should I use it?
-
Spatial oversampling is adjusted for in the sample weights in the same way as urban/rural oversampling.
GridSample overlays a coarse grid of a specified dimension on the survey area, and ensures that at least one cluster is sampled per coarse grid cell. Any newly selected clusters are added to the total sample size.
Spatial oversampling is recommended when survey results will be used to generate small area estimates.
- What is the GHS-SMOD dataset, and how is it used in GridSample?
-
GHS-SMOD is a global model of human settlement types produced by the European Commission Global Human Settlement Layer Project. The dataset combines human population density and built areas to produce 1 km x 1 km cells classified as unsettled (0), rural (1), low-dense urban (2), or high-dense urban (3).
GHS-SMOD is used in GridSample to implicitly stratify all samples by population density within administrative (or other geographic) strata, ensuring a sample that is representative across settlement types.
GHS-SMOD can optionally be used to stratify samples by urban and rural, or limit the coverage area of a survey to urban areas. Urban is defined by 1km x 1km cells classified as high-dense urban (3). This generally results in contiguous areas which align with the functional boundaries of cities.
- Can I use GridSample offline?
-
Yes, though you will need some programming skills.
The GridSample2.0 algorithm which underlies GridSample.org is written in Python and available at Flowminder’s Github account: