Step-by-step instructions to enter your survey design parameters into the GridSample tool.

Download GridSample User Manual (PDF)

Design your survey

Before using GridSample, have a clear research question, decide the survey design and calculate sample size.

Several resources are available to assist with survey planning including materials produced by the World Health Organization (WHO) Vaccination Coverage Cluster Surveys, Multiple Indicator Cluster Surveys (MICS,), and Demographic and Health Surveys (DHS).

Primary question to address with survey

The primary question affects the survey design, sample size, and budget. Identify the type of question that the survey aims to address.

  • Classification question
  • Estimation question
  • Comparison question

A classification survey labels groups as “pass”, “marginal”, or “fail” to inform programmatic decisions

Example question: Which health districts have low coverage of antenatal care for pregnant women?

Inferential goal:

  • Pass/fail threshold

Uncertainty is reported as:

  • Misclassification of pass
  • Misclassification of fail

Example parameters:

  • Pass/fail threshold: 90%
  • Misclassify passes: 5%
  • Misclassify fails: 10%

Generally requires 15+ PSUs per stratum

An estimation survey results in quantitative estimates in one or more groups

Example question: What percent of pregnant women receive one or more antenatal care visits?

Inferential goal:

  • Coverage estimate

Uncertainty is reported as:

  • Confidence interval

Design parameter:

  • 𝛼 (alpha) - the probability of Type 1 error - the hypothesis test declares the difference to be statistically significant when, in truth, it is not

Example parameters:

  • 𝛼 = 5% (95% confidence interval)

Generally requires 30+ PSUs per stratum

A comparative survey yields a quantitative estimate of difference between two groups, or of change between two time points

Example question: Has the percent of pregnant women receiving antenatal care increased since the last survey?

Inferential goal:

Minimum detectable difference between 2 groups

Uncertainty is reported as:

  • Confidence interval

Design parameter:

  • 𝛼 (alpha) - the probability of Type 1 error - the hypothesis test declares the difference to be statistically significant when, in truth, it is not
  • 1-𝛽 (beta) - the power of the test - this is the probability that the hypothesis correctly identified a statistically significant difference

Example parameters:

  • difference = 10% or more
  • 2-sided hypothesis test
  • 𝛼 = 5% (95% confidence interval)
  • power = 80% (𝛽 = 20%)

Sample size is highly dependent on the difference between groups and design parameters. 30-60 PSUs per stratum.

Sample design, sample size, and budget

Calculating a sample size that both meets the inferential goals of the survey and the budget constraints is an iterative process that must be negotiated within a survey steering group. The below sample size + budget spreadsheet is provided with the WHO Vaccination Coverage Survey Guidelines to generate multiple side-by-side scenarios.

Sample Size + Budget Calculator

Checklist before you use GridSample

  • I know the coverage area of the survey
  • I know the year the survey will be implemented
  • I know whether the survey will be stratified, and the geographic boundaries of those strata
  • I know the multi-stage cluster sampling design
  • I know the target cluster size
  • I know the target sample size (number of clusters, and households per cluster)

Use the GridSample Tool

About the tool

GridSample is designed with eight tabs, a click-and-point interface and pre-loaded datasets to ensure selection of your gridded population survey clusters is transparent and easy.

The following tabs are required: ID, Coverage, Frame, Design, Target, and Sample Size. If complex survey design characteristics are flagged in the Design tab, then the user will be prompted to enter additional parameters in the Strata and/or Spatial tabs.

  1. ID: Your email serves as a user ID to access previously entered GridSample jobs
  2. Coverage: Define the boundary of your survey area as urban/rural, administrative units, or a custom area defined with a zipped shapefile.
  3. Frame: Select the WorldPop Global dataset to be used as the base of your sample frame, and define sample frame units as cells (of any size), multi-cell gridded clusters (of three sizes), or custom areas defined with a zipped shapefile.
  4. Design: Specify key survey design features including the number of sampling stages and whether to include stratification and/or spatial oversampling.
  5. Strata (optional): Define strata boundaries by urban/rural areas, administrative units, or custom areas defined with a zipped shapefile.
  6. Spatial (optional): Define the size of areas to be used for spatial oversampling.
  7. Target: Specify the target population and average household size to transform WorldPop Global population estimates into household estimates
  8. Sample size: Specify the total number of households and clusters to be sampled, and if applicable, how clusters will be allocated to strata.

Sample weights

Sample weights are necessary to make accurate estimates of the population with household survey data. Sample weights adjust for unequal probabilities of selection among households, and are comprised of the design weight, segmentation adjustments if the cluster was divided and further sampled, and response rates of households and individuals selected for sampling.

GridSample provides design weights reflecting probability of selection from the sample frame. These cannot be used in place of sample weights. Instructions to calculate sample weights with additional information about segmentation and response rates are provided in the GridSample User Manual (PDF).

GridSample Sample Weights

Exercises

Improve your understanding (and confidence!) using GridSample with exercises to replicate existing survey designs provided in the GridSample User Manual (PDF).

Implement Your Survey

Four approaches and various tools are available to implement your gridded population survey. Learn about and compare these approaches and tools below.

Approaches

  • Cell
  • GridEZ
  • Own boundaries
  • SRS or non-probability

Grid cells of any size can be generated and sampled with GridSample. Cells will always be a multiple of 100m X 100m grid cells.This approach results in a sample frame of units that are uniform in size, but not in population.This approach is generally not used on its own for household survey sampling, but might be useful for other applications.

Cell (300x300m)

A sample frame of multi-cell units with approximately the same population in each unit and maximum area can be generated with the gridEZ algorithm. Multi-cell units can be sampled and used directly, segmented manually along natural features, or segmented automatically along 100m X 100m cell boundaries for fieldwork.

gridEZ original boundaries. This approach was used in Nepal by Elsey et al (2016). It was also used in Mozambique by World Vision International (2018) and is a featured case study.

gridEZ, segment along natural boundaries. This approach was used in Myanmar by Munoz and Langeraar (2013) and in Somalia by Pape and Wollberg (2019). It was also used in Nepal by Elsey et al (2018) and is a World Vision case study.

gridEZ, segment along sub-cell boundaries. This approach was used by the World Food Programme (2018) in DR Congo and is a featured case study. Sub-cells were randomised and fully enumerated until the target number of households per cluster was achieved, allowing for one field visit and calculation of sample probability weights as a one-stage segmented survey design.


GridSample allows users to define custom sample frame boundaries by uploading a zipped shapefile. This approach is suitable if census enumeration areas or other boundaries are available, and population estimates need to be updated. The output from GridSample and fieldwork approach is identical to a standard household survey.

Some researchers, particularly in urban areas or other densely settled areas (e.g. IDP camps) survey a random sample of households. A simple random sample of buildings can be selected via GridSample by first sampling 100m X 100m WorldPop cells, then using a technique such as random point placement, or random selection of mini grid cells in a GIS to identify one building at random.

This approach can also be used to identify a random starting point for non-probability sampling techniques such as “random walk” or “spin-the-pen”. Galway et al. (2012) used this approach in Iraq.

Field tools

  • Higher-tech
  • Lower-tech

Navigation

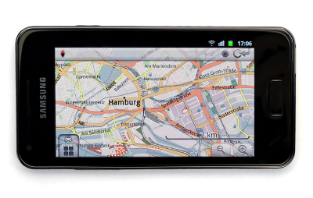
In urban areas where most roads are mapped in OpenStreetMap, MAPS.ME allows for offline navigation over very long distances. In areas where OpenStreetMap data are sparse, navigation based on GPS coordinates and place names may be necessary.

Within clusters, an app such as OSMAnd can be used for offline navigation based on preloaded MBTiles, displaying a blue dot at the device location.

Digital Maps

Mapping

Applications such as Vespucci allow for tablet-based updates to OpenStreetMap in the field. While this is a seemingly efficient way to reduce steps during fieldwork, we have found that field-based tablet editing of OpenStreetMap is time-intensive and frustrating for staff working on small screens often in adverse weather conditions.

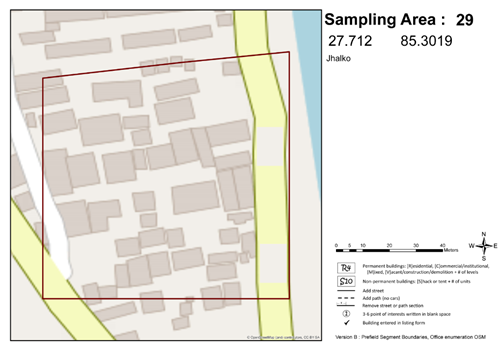
In our experience, survey teams almost unanimously prefer printed geographic maps in the field with OpenStreetMap or satellite imagery as a base layer. This is because paper maps can be marked up quickly in the field with a pencil, and edits to OpenStreetMap can be made quickly after fieldwork in the comfort of an office. Furthermore, field teams that have compared paper and tablet mapping say that paper maps produced in ArcGIS or QGIS helped to facilitate positive conversations with residents about the survey while editing maps on tablets in the field fueled suspicion.

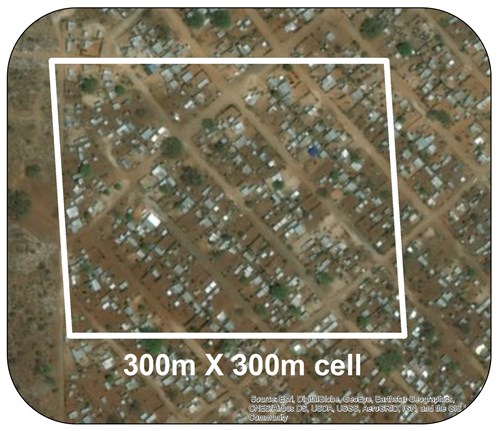
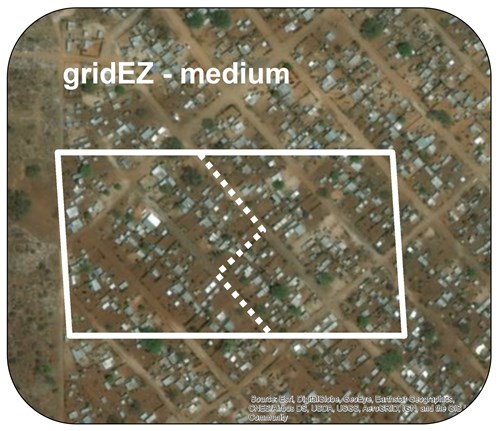
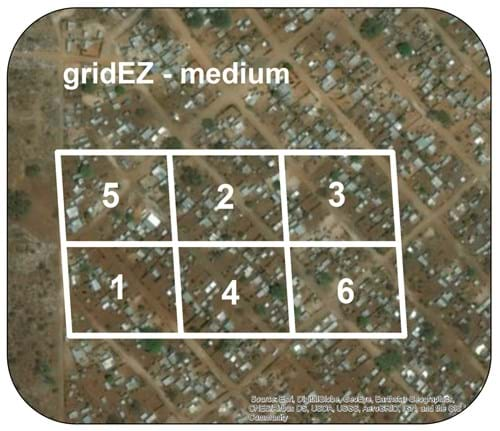
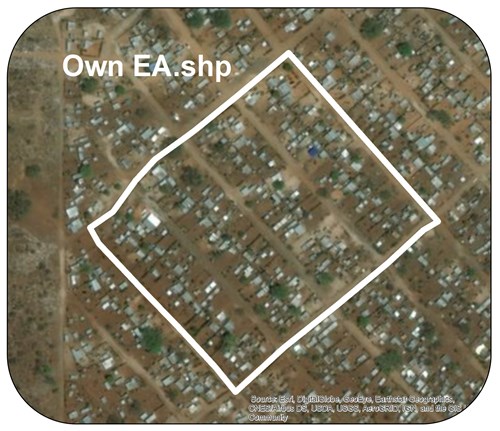
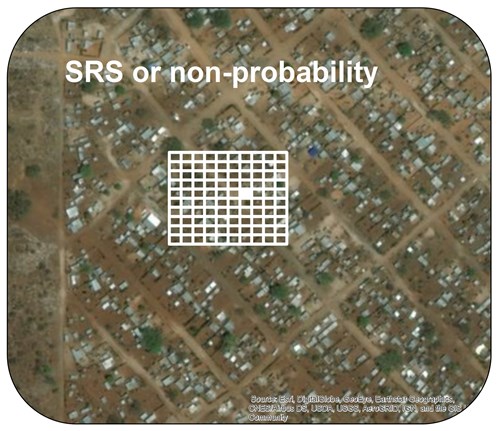
Whichever mapping approach you choose, it is wise to update roads and building footprints in OpenStreetMap using iDeditor or similar tool before visiting the field. GridSample cluster boundaries can be visualized on top of OpenStreetMap as a GPX trace file, keeping the dataset private. QGIS and a number of free apps can be used to transform the GridSample shapefile or KML file of cluster boundaries to a GPX file.

Sampling areaOpen Street Map screenshot

Listing

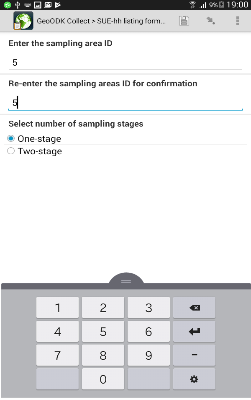
A number of apps are available to collect household listing data. Many of these apps, including OpenMapKit, GeoODK, and KoBoToolbox, also allow for collection of spatial data. Other tablet-based apps include the World Bank’s Survey Solutions tool which enables monitoring of fieldworkers.

Questionnaire

The same apps used for listing - OpenMapKit, GeoODK, Kobo Collect, Survey Solutions - can be used to administer questionnaires.

Tablet-based data collection requires a server, someone to design and configure the data collection form, and someone to set up, secure, and maintain all the devices. All the linked apps and programmes are free, and most are open source.

The Surveys for Urban Equity guides for survey planners and field teams provide guidance to implement higher-tech field tools and methods for a gridded population survey.

GeoODK

Navigation

If you are working in a context without power, in a team with limited technical skills, or your field staff face high security risks, you will likely opt to use lower-tech tools, and possibly avoiding tablets or GPS units in the field. Lower-tech navigation to clusters can be done with a travel map and asking for directions based on place names.

Mapping

Going lower-tech does not mean that field staff need to sacrifice geographically accurate maps. Two simple options are available to produce field maps to navigate and update building footprints in the field.

In rural contexts, satellite imagery from Google Earth is generally a suitable base map. Simply double-click the KML file of cluster boundaries provided in the GridSample output to visualise cluster boundaries in Google Earth. Then zoom to each cluster and print, recording the Cluster ID on each map.

In dense urban contexts where buildings are attached, the OpenStreetMap base layer may be needed to distinguish buildings and walking paths. The Field Papers website can be used to generate a map with the OpenStreetMap or Bing imager base layer for each cluster.

Many current surveys require field staff to hand-sketch maps of roads, buildings, and points of interest on a blank piece of paper. This approach is decades old but does not result in a geographically accurate map, and it is time intensive for field staff.

Listing and questionnaire

Printed paper forms provide a low-tech solution to conduct the household listing and administer questionnaires.

The linked tools are free and open source.